You have skipped the navigation, tab for page content
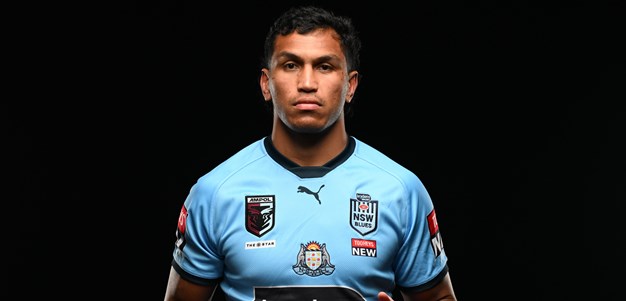
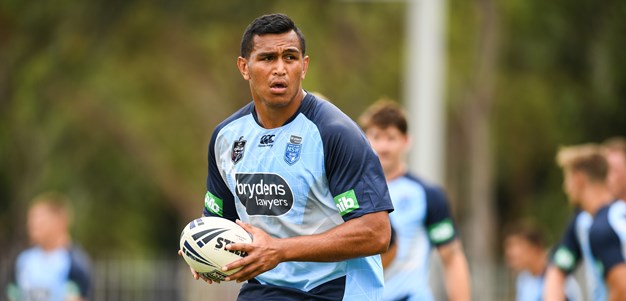
Jacob Saifiti
Prop
Player Bio
- Height:
- 195 cm
- Date of Birth:
- 01 May 1996
- Weight:
- 114 kg
- Birthplace:
- Newcastle, NSW
- Age:
- 28
- Nickname:
- JSaf
- Debut Club:
- Newcastle Knights
- Date:
- 06 March 2016
- Opposition:
- Gold Coast Titans
- Round:
- 1
- Previous Club:
- -
- Junior Club:
- The Entrance Tigers
- Biography:
Knight #269
2021 Danny Buderus Medal winner and NSW Origin representative, Jacob Saifiti has continually elevated his game since his debut in 2016.
Jacob made his debut for the Knights in 2016, alongside twin brother Daniel, becoming the first twins to debut together in the NRL's history.
Saifiti has spent nine seasons in the red and blue jumper and was honored with a Life Membership with the Club during the 2023 season.
A powerhouse middle forward and pathways graduate, J-Saf is signed on until at least the end of the 2027 season.
Career
- Appearances
- 158
- Tries
- 12
2024 Season
- Appearances
- 16
Scoring
- Tries
- 1
Attack
- Tackle Breaks
- 18
- Average Hit Ups
- 10.4
- Post Contact Metres
- 825.1
Passing
- Offloads
- 4
Defence
- Tackles Made
- 433
- Tackle Efficiency
-
Running Metres
- Average Running Metres
- 118
- Total Running Metres
- 1900
Fantasy
- Total Points
- 643
- Average Points
- 40.2
2024 Season - By Round
Round | Opponent | Score | Position | Minutes Played | Tries | Goals | 1 Point Field Goals | 2 Point Field Goals | Points | Try Assists | Linebreaks | Tackle Breaks | Post Contact Metres | Offloads | Receipts | Tackles Made | Missed Tackles | Total Running Metres | Hit Up Running Metres | Kick Return Metres | |
---|---|---|---|---|---|---|---|---|---|---|---|---|---|---|---|---|---|---|---|---|---|
1 | Raiders | Lost | 12 - 28 | Prop | 50 | - | - | - | - | - | - | - | - | 45 | 1 | 13 | 32 | 2 | 122 | 95 | 27 |
2 | Cowboys | Lost | 21 - 20 | Prop | 42 | - | - | - | - | - | - | - | - | 52 | - | 14 | 27 | - | 136 | 110 | 25 |
3 | Storm | Won | 14 - 12 | Prop | 50 | - | - | - | - | - | - | - | - | 62 | - | 13 | 25 | 4 | 123 | 123 | - |
4 | Warriors | Lost | 20 - 12 | Prop | 55 | - | - | - | - | - | - | - | 1 | 44 | - | 10 | 41 | 2 | 103 | 91 | 12 |
5 | Dragons | Won | 30 - 10 | Prop | 43 | - | - | - | - | - | - | - | - | 62 | - | 12 | 27 | 2 | 133 | 105 | 27 |
6 | Roosters | Lost | 20 - 22 | Prop | 53 | - | - | - | - | - | - | - | 1 | 69 | - | 14 | 29 | 2 | 139 | 116 | 22 |
7 | Bulldogs | Lost | 36 - 12 | Interchange | 50 | - | - | - | - | - | - | - | 1 | 44 | 1 | 14 | 28 | 1 | 90 | 90 | - |
8 | Dolphins | Won | 14 - 18 | Prop | 34 | - | - | - | - | - | - | - | 1 | 51 | - | 14 | 17 | - | 122 | 90 | 32 |
11 | Titans | Won | 24 - 28 | Prop | 46 | 1 | - | - | - | 4 | 1 | 1 | 1 | 49 | - | 13 | 26 | 1 | 156 | 116 | 40 |
13 | Bulldogs | Lost | 2 - 32 | Prop | 46 | - | - | - | - | - | - | - | 2 | 43 | - | 12 | 31 | 1 | 89 | 89 | - |
14 | Storm | Lost | 36 - 28 | Prop | 48 | - | - | - | - | - | - | - | 3 | 57 | 1 | 15 | 24 | 2 | 139 | 114 | 18 |
15 | Panthers | Lost | 18 - 26 | Prop | 45 | - | - | - | - | - | - | - | 2 | 33 | - | 8 | 29 | 2 | 74 | 63 | 11 |
17 | Eels | Won | 34 - 26 | Prop | 55 | - | - | - | - | - | - | - | 4 | 32 | - | 8 | 30 | - | 91 | 53 | 37 |
18 | Raiders | Won | 12 - 16 | Interchange | 48 | - | - | - | - | - | - | - | 2 | 80 | - | 15 | 26 | 1 | 157 | 120 | 36 |
19 | Sea Eagles | Lost | 44 - 6 | Interchange | 39 | - | - | - | - | - | - | - | - | 56 | - | 10 | 23 | 1 | 110 | 110 | - |
20 | Broncos | Lost | 14 - 30 | Interchange | 36 | - | - | - | - | - | - | - | - | 46 | 1 | 12 | 18 | 2 | 108 | 96 | 11 |
Career By Season
Year | Played | Won | Lost | Drawn | Win % | Tries | Goals | 1 Point Field Goals | 2 Point Field Goals | Points | Kicking Metres | Kicking Metres Average | Tackle Breaks | Post Contact Metres | Offloads | Tackles Made | Missed Tackles | Tackle Efficiency | Total Running Metres | Average Running Metres | Kick Return Metres | Total Points | Average Points | |
---|---|---|---|---|---|---|---|---|---|---|---|---|---|---|---|---|---|---|---|---|---|---|---|---|
Knights | 2016 | 18 | 1 | 16 | 1 | 6% | 2 | - | - | - | 8 | 38 | 2.13 | 18 | 451 | 4 | 465 | 43 | 86.81% | 1,417 | 78.00 | 114 | 560 | 31.1 |
Knights | 2017 | 21 | 5 | 16 | - | 24% | 1 | - | - | - | 4 | - | - | 14 | 656 | 2 | 411 | 39 | 91.33% | 1,723 | 82.00 | 357 | 515 | 24.5 |
Knights | 2018 | 8 | 3 | 5 | - | 38% | - | - | - | - | - | - | - | 2 | 141 | - | 122 | 8 | 93.85% | 416 | 52.00 | 124 | 148 | 18.5 |
Knights | 2019 | 7 | 2 | 5 | - | 29% | - | - | - | - | - | - | - | 1 | 123 | - | 109 | 7 | 93.97% | 347 | 49.00 | 118 | 124 | 17.7 |
Knights | 2020 | 21 | 11 | 9 | 1 | 52% | 3 | - | - | - | 12 | - | - | 22 | 908 | 1 | 587 | 31 | 94.98% | 2,348 | 111.00 | 565 | 843 | 40.1 |
Knights | 2021 | 23 | 12 | 11 | - | 52% | 3 | - | - | - | 12 | - | - | 29 | 844 | 2 | 598 | 41 | 93.58% | 2,437 | 105.00 | 557 | 864 | 37.6 |
Knights | 2022 | 23 | 6 | 17 | - | 26% | 1 | - | - | - | 4 | - | - | 5 | 913 | 5 | 611 | 29 | 95.47% | 2,239 | 97.00 | 471 | 812 | 35.3 |
Knights | 2023 | 21 | 13 | 8 | - | 62% | 1 | - | - | - | 4 | - | - | 23 | 892 | 5 | 475 | 39 | 92.41% | 2,464 | 117.00 | 684 | 692 | 33.0 |
Knights | 2024 | 16 | 6 | 10 | - | 38% | 1 | - | - | - | 4 | - | - | 18 | 825 | 4 | 433 | 23 | 94.96% | 1,900 | 118.00 | 303 | 643 | 40.2 |
Career Overall
Year Start | Year End | Played | Won | Lost | Drawn | Win % | Tries | Goals | 1 Point Field Goals | 2 Point Field Goals | Points | Kicking Metres | Kicking Metres Average | Tackle Breaks | Post Contact Metres | Offloads | Tackles Made | Missed Tackles | Tackle Efficiency | Total Running Metres | Average Running Metres | Kick Return Metres | Total Points | Average Points | |
---|---|---|---|---|---|---|---|---|---|---|---|---|---|---|---|---|---|---|---|---|---|---|---|---|---|
- | - | - | - | - | - | - | - | - | - | - | - | - | - | - | - | - | - | - | - | - | - | - | - | - | - |
Knights | 2016 | 2024 | 158 | 59 | 97 | 2 | 37% | 12 | - | - | - | 48 | 38 | 0.24 | 132 | 5,752 | 23 | 3,810 | 260 | 93.61% | 15,293 | 96.00 | 3,297 | 5,200 | 32.9 |