You have skipped the navigation, tab for page content
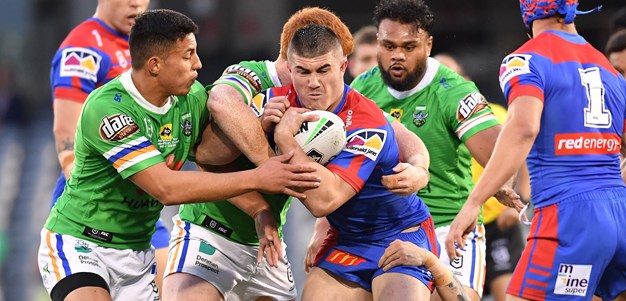
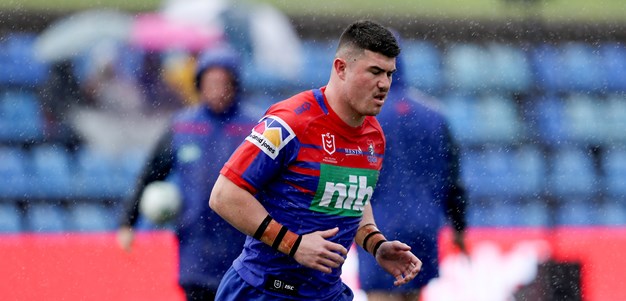
Bradman Best
Centre
Player Bio
- Height:
- 182 cm
- Date of Birth:
- 09 August 2001
- Weight:
- 103 kg
- Birthplace:
- Central Coast, NSW
- Age:
- 23
- Nickname:
- Braddy
- Debut Club:
- Newcastle Knights
- Date:
- 24 August 2019
- Opposition:
- Wests Tigers
- Round:
- 23
- Previous Club:
- -
- Junior Club:
- Woy Woy Roosters
- Biography:
Knight #311
A man with one of the 'best' names in the NRL, Bradman boasts fearsome strength and speed in the Knights centres.
A product of the Knights pathways system, Best represented NSW at Under 16's and Under 18's at State level and played for the Australian Schoolboys.
Best became the second youngest player to debut for the Knights back in Round 23 of 2019 and has spent six seasons in the red and blue jumper.
A Central Coast junior and NSW Origin representative, Best is signed to the Club until at least the end of the 2027 season.
Career
- Appearances
- 87
- Tries
- 37
2024 Season
- Appearances
- 17
Scoring
- Tries
- 7
Attack
- Try Assists
- 6
- Line Breaks
- 10
- Tackle Breaks
- 49
Passing
- Receipts
- 289
Defence
- Tackles Made
- 249
- Missed Tackles
- 33
- Tackle Efficiency
-
Running Metres
- Average Running Metres
- 163
- Total Running Metres
- 2781
Fantasy
- Total Points
- 741
- Average Points
- 43.6
2024 Season - By Round
Round | Opponent | Score | Position | Minutes Played | Tries | Goals | 1 Point Field Goals | 2 Point Field Goals | Points | Kicking Metres | Try Assists | Linebreaks | Tackle Breaks | Post Contact Metres | Offloads | Receipts | Tackles Made | Missed Tackles | Total Running Metres | Hit Up Running Metres | Kick Return Metres | |
---|---|---|---|---|---|---|---|---|---|---|---|---|---|---|---|---|---|---|---|---|---|---|
1 | Raiders | Lost | 12 - 28 | Centre | 80 | - | - | - | - | - | - | - | - | - | 38 | 1 | 15 | 20 | 1 | 91 | - | 2 |
2 | Cowboys | Lost | 21 - 20 | Centre | 82 | - | - | - | - | - | - | - | - | 1 | 45 | - | 17 | 18 | 3 | 102 | - | - |
3 | Storm | Won | 14 - 12 | Centre | 80 | - | - | - | - | - | 22 | - | - | - | 74 | - | 20 | 9 | 3 | 171 | 29 | - |
4 | Warriors | Lost | 20 - 12 | Centre | 80 | 1 | - | - | - | 4 | - | - | - | 3 | 86 | 1 | 31 | 16 | - | 198 | 10 | 1 |
5 | Dragons | Won | 30 - 10 | Centre | 80 | - | - | - | - | - | - | - | - | 1 | 42 | - | 13 | 15 | 2 | 90 | - | - |
6 | Roosters | Lost | 20 - 22 | Centre | 80 | 1 | - | - | - | 4 | - | - | 1 | 2 | 108 | - | 22 | 12 | - | 274 | - | - |
7 | Bulldogs | Lost | 36 - 12 | Centre | 80 | 1 | - | - | - | 4 | - | - | 1 | 6 | 34 | - | 17 | 15 | - | 107 | 13 | - |
8 | Dolphins | Won | 14 - 18 | Centre | 80 | - | - | - | - | - | - | - | - | 5 | 77 | - | 17 | 18 | 3 | 192 | - | - |
9 | Warriors | Won | 14 - 8 | Centre | 80 | - | - | - | - | - | - | - | 1 | 5 | 48 | 1 | 17 | 17 | 2 | 146 | - | - |
10 | Wests Tigers | Won | 14 - 20 | Centre | 80 | 1 | - | - | - | 4 | 1 | 1 | 3 | 11 | 34 | 2 | 19 | 19 | 2 | 235 | - | 61 |
11 | Titans | Won | 24 - 28 | Centre | 41 | - | - | - | - | - | 31 | - | - | - | 27 | - | 7 | 8 | 1 | 69 | - | - |
15 | Panthers | Lost | 18 - 26 | Centre | 80 | 1 | - | - | - | 4 | - | - | 1 | - | 68 | 1 | 23 | 14 | 4 | 209 | - | - |
17 | Eels | Won | 34 - 26 | Centre | 80 | 2 | - | - | - | 8 | - | 2 | 2 | 8 | 56 | 1 | 17 | 16 | 2 | 357 | - | - |
18 | Raiders | Won | 12 - 16 | Centre | 80 | - | - | - | - | - | - | 1 | - | 1 | 94 | - | 20 | 20 | 5 | 193 | - | 26 |
20 | Broncos | Lost | 14 - 30 | Centre | 9 | - | - | - | - | - | - | - | - | 1 | 5 | - | 3 | 2 | - | 16 | - | - |
26 | Titans | Won | 36 - 14 | Centre | 73 | - | - | - | - | - | 28 | 2 | 1 | 4 | 66 | 2 | 16 | 13 | - | 218 | - | 5 |
27 | Dolphins | Won | 14 - 6 | Centre | 80 | - | - | - | - | - | - | - | - | 1 | 46 | - | 15 | 17 | 5 | 106 | - | - |
Career By Season
Year | Played | Won | Lost | Drawn | Win % | Tries | Goals | 1 Point Field Goals | 2 Point Field Goals | Points | Kicking Metres | Kicking Metres Average | Goal Conversion Rate | Forced Drop Outs | Try Assists | Linebreaks | Receipts | Tackles Made | Missed Tackles | Tackle Efficiency | Total Running Metres | Average Running Metres | Kick Return Metres | Total Points | Average Points | |
---|---|---|---|---|---|---|---|---|---|---|---|---|---|---|---|---|---|---|---|---|---|---|---|---|---|---|
Knights | 2019 | 3 | 1 | 2 | - | 33% | 1 | - | - | - | 4 | - | - | - | - | 1 | 1 | 35 | 35 | 4 | 89.74% | 272 | 90.00 | 28 | 76 | 25.3 |
Knights | 2020 | 11 | 4 | 6 | 1 | 36% | 8 | - | - | - | 32 | 35 | 3.16 | - | - | 4 | 5 | 203 | 157 | 17 | 90.23% | 1,687 | 153.00 | 17 | 482 | 43.8 |
Knights | 2021 | 17 | 10 | 7 | - | 59% | 3 | - | - | - | 12 | 38 | 2.22 | - | - | 6 | 6 | 250 | 270 | 29 | 90.30% | 2,064 | 121.00 | 44 | 627 | 36.9 |
Knights | 2022 | 14 | 4 | 10 | - | 29% | 5 | - | - | - | 20 | 92 | 6.55 | - | 2 | 4 | 7 | 194 | 217 | 35 | 86.11% | 1,497 | 106.00 | 45 | 488 | 34.9 |
Knights | 2023 | 25 | 14 | 10 | 1 | 56% | 13 | - | - | - | 52 | 17 | 0.69 | - | - | 16 | 11 | 371 | 369 | 47 | 88.70% | 3,274 | 130.00 | 44 | 1,042 | 41.7 |
Knights | 2024 | 17 | 10 | 7 | - | 59% | 7 | - | - | - | 28 | 82 | 4.80 | - | - | 6 | 10 | 289 | 249 | 33 | 88.30% | 2,781 | 163.00 | 97 | 741 | 43.6 |
Career Overall
Year Start | Year End | Played | Won | Lost | Drawn | Win % | Tries | Goals | 1 Point Field Goals | 2 Point Field Goals | Points | Kicking Metres | Kicking Metres Average | Goal Conversion Rate | Forced Drop Outs | Try Assists | Linebreaks | Receipts | Tackles Made | Missed Tackles | Tackle Efficiency | Total Running Metres | Average Running Metres | Kick Return Metres | Total Points | Average Points | |
---|---|---|---|---|---|---|---|---|---|---|---|---|---|---|---|---|---|---|---|---|---|---|---|---|---|---|---|
Knights | 2019 | 2024 | 87 | 43 | 42 | 2 | 49% | 37 | - | - | - | 148 | 263 | 3.02 | - | 2 | 37 | 40 | 1,342 | 1,297 | 165 | 88.71% | 11,577 | 133.00 | 278 | 3,456 | 39.7 |